
Cricket Statistics for Betting Analysis: Numbers That Matter
 Available in US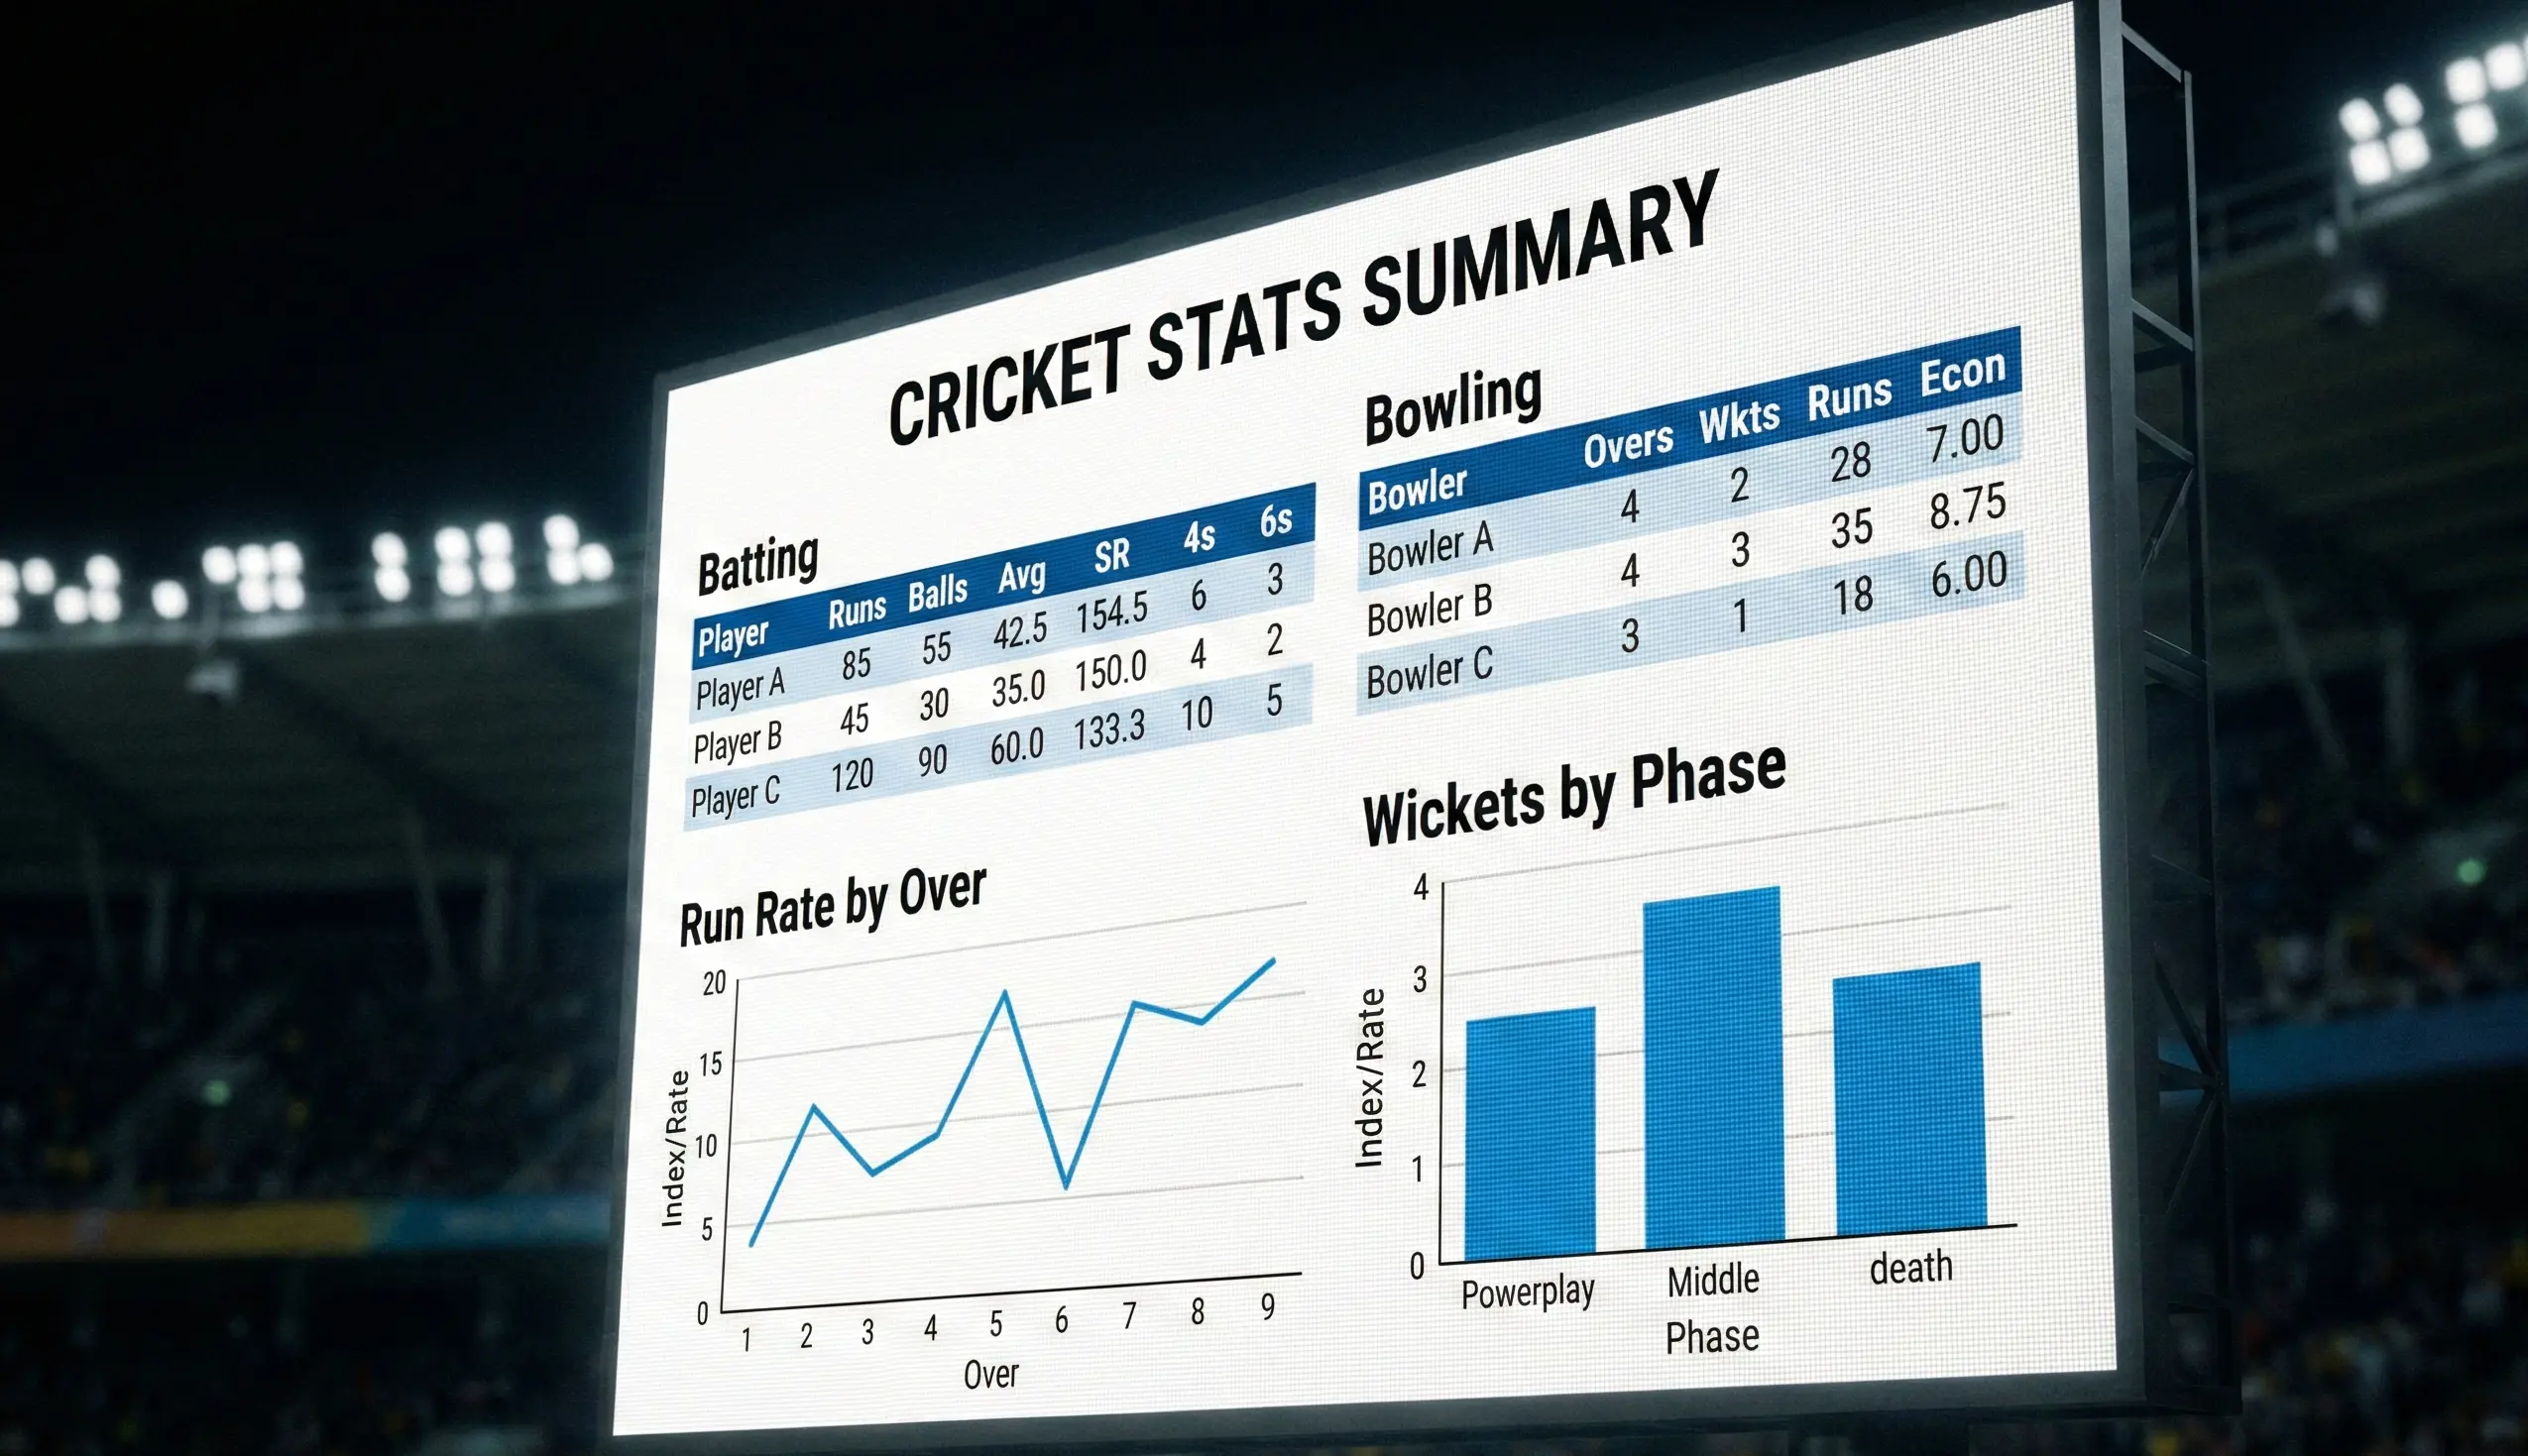
Cricket generates more statistics than almost any other sport. Every ball produces data—runs scored, wickets taken, extras conceded, field placements, bowling speeds, shot types. This abundance creates both opportunity and confusion for bettors. The right statistics improve predictions; the wrong ones create false confidence. Knowing which numbers matter—and which mislead—separates statistical sophistication from statistical noise.
What makes cricket statistics particularly valuable for betting is their objectivity. While assessments of team quality or player form involve subjective judgment, statistics provide concrete benchmarks. A batsman averaging 45 in subcontinental conditions is objectively different from one averaging 30, regardless of reputation or perception. Building analysis on statistical foundations grounds predictions in reality rather than narrative.
Batting Statistics That Matter
Not all batting statistics predict future performance equally. Understanding which metrics contain signal helps focus analysis on meaningful numbers.
Batting average remains the most reliable single batting statistic. Runs scored divided by dismissals captures both scoring ability and consistency. While average doesn't capture everything—two batsmen with identical averages might score very differently in terms of strike rate and role—it provides the best single-number summary of batting quality.
Strike rate matters differently by format. In Test cricket, high strike rate is nice but not essential—what matters is scoring runs without getting out. In T20 cricket, strike rate is often more important than average. A T20 batsman averaging 25 at 150 strike rate might contribute more than one averaging 35 at 110. Format context determines which metric receives more weight.
Runs per innings sometimes captures information average misses. A batsman with many not-outs might have an inflated average because the denominator (dismissals) is artificially low. Runs per innings—total runs divided by total innings—doesn't suffer this distortion, making it useful for assessing batsmen who frequently remain not out.
Bowling Statistics That Matter
Bowling statistics present different challenges than batting statistics because wickets involve more variance than runs.
Bowling average (runs conceded per wicket) indicates overall bowling effectiveness. Lower averages indicate bowlers who take wickets without conceding many runs. For betting on series or tournament top bowler markets, career and recent bowling averages help identify likely wicket-takers.
Economy rate (runs conceded per over) matters particularly in limited-overs cricket where containing runs is often as valuable as taking wickets. A bowler conceding 4 runs per over while taking 1-30 might be more valuable than one taking 2-50 at 8 runs per over. T20 and ODI analysis should weight economy heavily.
Strike rate for bowlers (balls bowled per wicket) indicates wicket-taking frequency. Lower strike rates mean more frequent wickets. For match top bowler betting, strike rate helps predict who will take the most wickets in limited overs—bowlers with low strike rates generate more dismissals per ball.

Sample Size Considerations
Cricket statistics require adequate sample sizes to be meaningful. Small samples produce unreliable conclusions that feel significant but don't predict well.
Career statistics provide stable baselines. A batsman's career average across hundreds of innings represents reliable underlying ability. This baseline changes slowly and predicts future performance reasonably well. When assessing general player quality, career numbers deserve substantial weight.
Recent form statistics are noisier but capture current state. A batsman's average over their last ten innings might differ significantly from career average—this could represent genuine form change or random variance. The fewer innings, the more variance dominates. Weight recent statistics for current form but don't abandon career baselines entirely.
Context-specific statistics often have dangerously small samples. A batsman's average in day-night Tests might span only five matches—too few to draw confident conclusions. These splits feel informative because they're specific, but specificity increases noise. Use context splits cautiously, recognizing their limited predictive power.
Venue and Condition Statistics
Cricket statistics vary dramatically by venue and conditions. Using overall numbers without controlling for context produces misleading analysis.
Home and away splits reveal condition adaptability. A batsman averaging 50 at home but 30 away performs very differently depending on location. For series or match betting, knowing which players maintain performance away from home conditions helps predict overseas tour outcomes.
Venue-specific statistics show how players perform at particular grounds. Some batsmen have favorite grounds where they consistently score heavily; others struggle at specific venues regardless of form. When matches occur at venues with substantial player history, venue-specific records provide actionable information.
Opposition-specific statistics—how players perform against particular teams—combine with venue and condition data. A batsman might average 60 against weak bowling attacks but 30 against strong ones. Understanding who players have faced when accumulating statistics helps interpret whether those numbers predict performance against upcoming opponents.
Team Statistics for Match Betting
Team-level statistics inform match betting more directly than individual statistics, though both matter.
Team win percentages provide baseline match expectations. A team winning 65% of home matches and 40% of away matches has different expectations depending on venue. These baselines should anchor match predictions before other factors adjust them.
First and second innings statistics matter in Test cricket. Some teams consistently bat well first but struggle in fourth innings chases. Others defend totals better than they set them. These asymmetries affect draw markets and match winner predictions depending on toss outcomes and match state.
Run rate statistics in limited-overs cricket indicate scoring style. Teams that score quickly in powerplays differ from those who accelerate late. These patterns affect live betting during matches and help predict totals based on expected scoring profiles.
Using Statistics for Player Markets
Player market betting relies heavily on statistical analysis because you're predicting individual rather than team outcomes.
Compare player statistics to match context when betting props. A batsman averaging 40 facing bowling attacks they've historically struggled against might not reach 40-run props lines. A bowler taking 2 wickets per match on average might underperform against batting lineups they've struggled to dismiss.
Tournament statistics help predict tournament player markets. Players who consistently perform in tournament settings—producing when pressure is highest—differ from those whose overall statistics come from bilateral series. Tournament-specific records, while smaller samples, reveal something about high-pressure performance.
Format-specific statistics should drive format-specific betting. A player's T20 statistics predict T20 performance better than their overall numbers do. When betting IPL or Big Bash player markets, use T20 statistics as primary inputs rather than blending formats.
Limitations of Statistical Analysis
Statistics inform betting but don't provide complete answers. Understanding their limitations prevents overconfidence.
Statistics describe what happened, not why it happened. A bowler's recent poor average might reflect bad form, or might reflect bowling on unhelpful pitches against strong batting. Statistics alone don't distinguish these explanations—you need additional context to interpret what numbers mean.
Future performance isn't perfectly predicted by past statistics. Players improve, decline, get injured, change techniques. Statistics provide the best available baseline but don't guarantee future replication. Appropriate uncertainty should accompany all statistical predictions.
Statistics can mislead when contexts change. Historical statistics collected in different conditions don't necessarily predict performance in new conditions. A batsman's career average means less when they're facing entirely new challenges—different formats, different conditions, different opposition quality.
Building Statistical Resources
Systematic statistical tracking improves betting analysis over time.
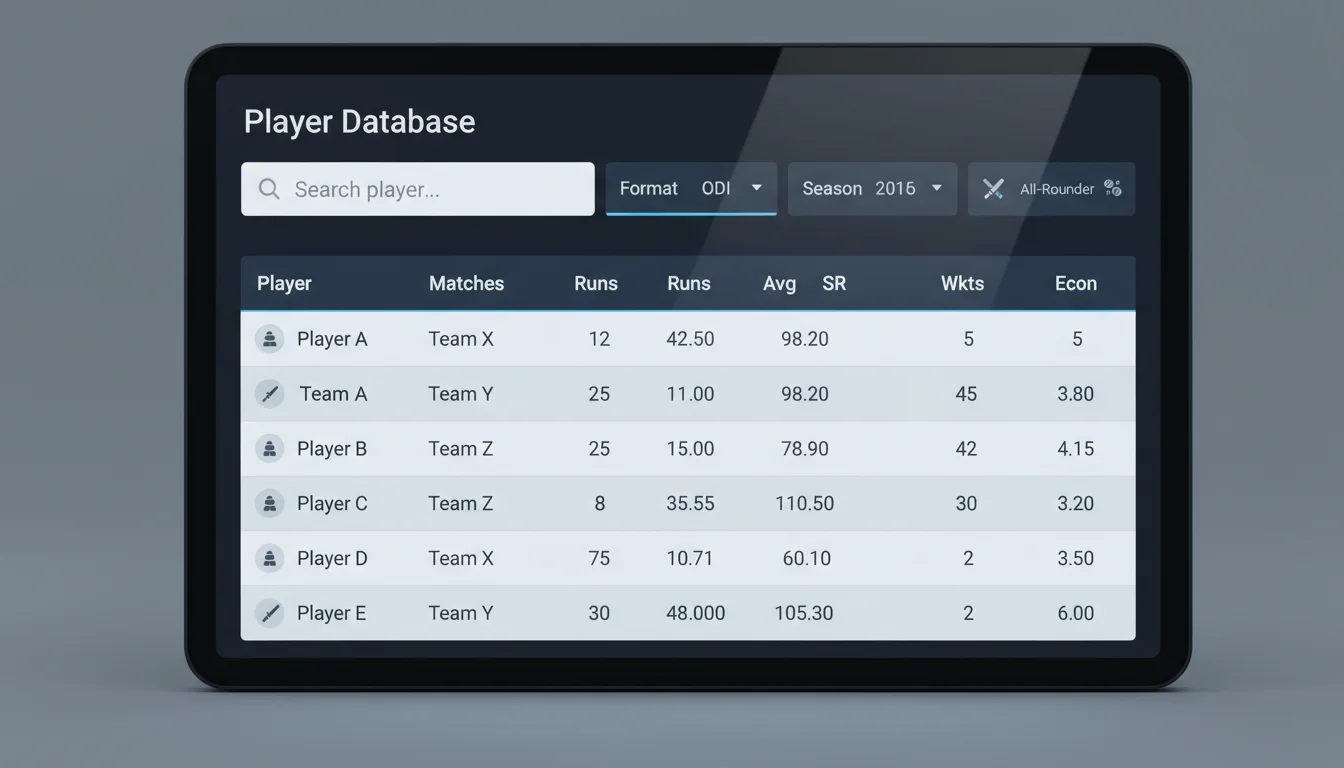
Maintain databases of statistics you find valuable. Whether spreadsheets or specialized software, organizing player and team statistics for easy access enables quick reference when betting decisions arise. Build resources gradually as you identify which statistics actually help your predictions.
Update statistics regularly to maintain currency. Player statistics change with each match; using outdated numbers produces outdated analysis. Develop habits of updating key statistics after matches you're likely to bet on.
Track which statistics correlate with your betting success. Do predictions based on bowling averages outperform those based on strike rates? Does venue-specific data improve your match predictions? This meta-analysis reveals which statistics actually help you specifically, rather than which seem theoretically useful.
